Short Answer
A rental property is not a good investment just because the rent covers part of the mortgage or because home prices might rise. A stronger test is:
cash invested today + monthly cash flow + sale proceeds later vs the same cash invested elsewhere.
In the scenario below, a $500,000 rental with $3,600 of monthly rent looks almost tied with a 7% stock alternative after 10 years. The property ends with about $219,000 of estimated wealth, while the stock alternative grows the same initial $115,000 to about $226,000. The property is only about $7,000 behind, but it requires a year-one cash shortfall of roughly $662 per month.
That is the useful lesson. A rental can be close on long-term wealth and still feel uncomfortable month to month, so the scenario below checks the property math against the opportunity cost of the same cash invested elsewhere.
What "Good Investment" Means Here
For a beginner, the question is not "Will this property go up?" It is more specific:
- How much cash do I put in at the start?
- How much money leaves or enters my bank account each month?
- How much equity might I have after selling costs?
- What could the same cash become if I invested it instead?
- Which assumption changes the answer the most?
The calculator compares a rental property with a stocks-side alternative. That matters because the down payment and closing costs are not free. If you buy the property, that money is tied up in the deal. If you do not buy, the same cash can compound somewhere else.
The Example Scenario
Here is a simple 10-year test case:
| Input | Scenario |
|---|---|
| Purchase price | $500,000 |
| Down payment | 20%, or $100,000 |
| Buyer closing costs | 3%, or $15,000 |
| Initial cash invested | $115,000 |
| Mortgage | $400,000 at 7% for 30 years |
| Monthly principal and interest | About $2,661 |
| Gross monthly rent | $3,600 |
| Vacancy | 5% |
| Property management | 8% of collected rent |
| Property tax, insurance, maintenance, and other operating expenses | About $1,147 per month |
| Home appreciation | 3% per year |
| Rent and expense growth | 3% per year |
| Selling costs | 6% at sale |
| Stocks-side alternative | 7% per year |
| Holding period | 10 years |
The numbers are intentionally plain. They are not a recommendation, a forecast, or a tax plan. They are a way to see which inputs drive the answer.
The tax section is also simplified. Rental tax rules can include ordinary rental income, operating expenses, mortgage interest, depreciation, passive activity limits, and depreciation recapture. The IRS explains the basics in Topic No. 414 and Publication 527, but a real investor should confirm the tax treatment with a qualified tax professional.
Open the prefilled $500,000 rental-vs-stocks scenario to start with the purchase price, rent, financing, vacancy, management, and expense assumptions above, then map the deal to your situation.
The First-Year Cash Flow Test
Start with the rent. A $3,600 monthly rent does not mean $3,600 of usable income.
| Step | Monthly amount |
|---|---|
| Gross scheduled rent | $3,600 |
| Less 5% vacancy | -$180 |
| Less 8% management fee on collected rent | -$274 |
| Net rent before expenses | $3,146 |
| Mortgage principal and interest | -$2,661 |
| Operating expenses | -$1,147 |
| Estimated year-one cash flow | -$662 per month |
That does not automatically kill the deal, but it changes the question. The investor is not just choosing a property. They are choosing to fund a monthly shortfall while waiting for equity, appreciation, rent growth, or tax effects to help the projection.
Vacancy deserves its own line because it is easy to ignore. The U.S. Census Bureau publishes Housing Vacancies and Homeownership data, and local vacancy can differ sharply from national data. In a calculator scenario, vacancy should be an explicit assumption, not a hopeful afterthought.
The Ten-Year Wealth Test
After 10 years at 3% annual appreciation, the $500,000 property is worth about $672,000 before selling costs. The remaining mortgage balance is about $343,000. After a 6% selling cost, estimated sale proceeds are about $288,000.
But the monthly shortfall matters. In this scenario, the property-side cash-flow account is about -$70,000 after 10 years because the investor had to cover shortfalls along the way. That brings estimated property wealth down to about $219,000.
The stocks-side alternative starts with the same $115,000 of down payment plus closing costs. At 7% per year for 10 years, it grows to about $226,000.
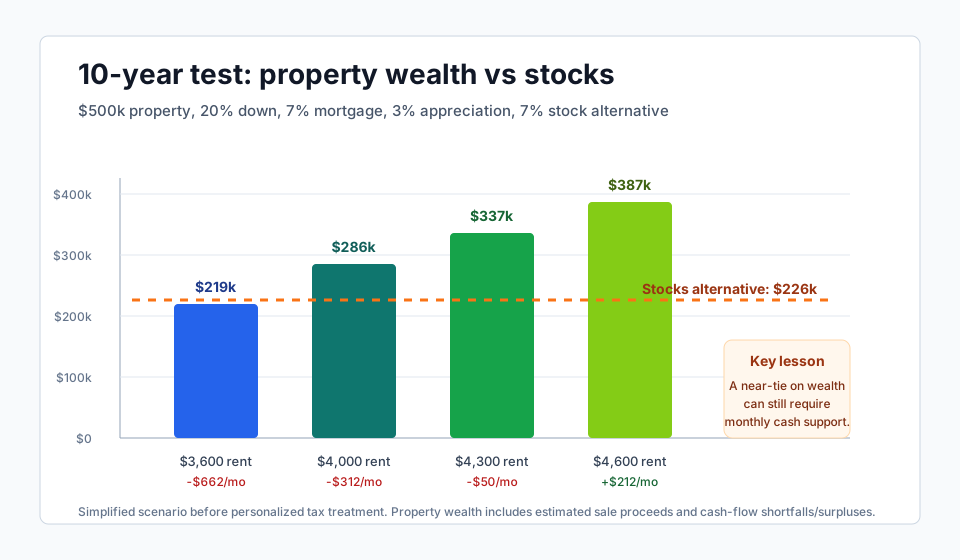
The visual shows why the full comparison matters. The $3,600 rent case is not a disaster, but it depends heavily on appreciation and the investor's ability to handle negative cash flow. At $4,000 rent, the property moves ahead in this simplified model. At $4,300 rent, it is much stronger.
The Rent Sensitivity Test
Using the same property, mortgage, appreciation, and stock-return assumptions:
| Monthly rent | Year-one monthly cash flow | Property wealth after 10 years | Stocks alternative after 10 years | Property advantage |
|---|---|---|---|---|
| $3,600 | -$662 | $219,000 | $226,000 | -$7,000 |
| $4,000 | -$312 | $286,000 | $226,000 | $60,000 |
| $4,300 | -$50 | $337,000 | $226,000 | $111,000 |
| $4,600 | $212 | $387,000 | $226,000 | $161,000 |
This is not saying "$4,000 rent makes the property good." It is saying rent is a major driver. A rent estimate from one listing, one optimistic broker, or one perfect month is not enough. Test the property with conservative rent, normal vacancy, and expenses that grow over time.
Do Not Skip Loan And Closing Details
The mortgage terms can make or break the result. The CFPB's guide to comparing Loan Estimates highlights the importance of comparing total monthly payment, upfront loan costs, and the five-year cost of borrowing. For investment property analysis, those details flow directly into cash flow and opportunity cost.
The example uses:
- 20% down
- 3% buyer closing costs
- 7% mortgage rate
- 30-year term
- 6% estimated selling costs later
If the rate rises, the monthly shortfall grows. If closing costs are higher, the stocks alternative starts with more money. If the holding period is short, selling costs have less time to be offset by principal paydown and appreciation.
What Changes The Answer?
Rent And Vacancy
Gross rent is the first number people quote, but collected rent is what pays the bills. Vacancy, turnover, concessions, and management fees reduce the number that actually hits the projection.
Operating Expenses
Property tax, insurance, maintenance, repairs, HOA dues, landscaping, utilities, and capital replacements can turn a promising rent number into a thin deal. The first version of a model should include boring expenses before it includes optimistic upside.
Appreciation
Appreciation can dominate the long-term result. The FHFA describes its House Price Index as a data series measuring changes in single-family home values across the country and many local markets. That is useful context, but it is not a promise for one property, one neighborhood, or one holding period.
In the $4,300 rent version of this example, reducing appreciation from 3% to 2% cuts the property advantage from about $111,000 to about $52,000. The property still looks ahead in this simplified scenario, but the cushion is much smaller.
The Alternative Investment Return
The stock-side comparison is not guaranteed either. It is an opportunity-cost assumption. A lower stock return makes the property look better. A higher stock return makes the hurdle harder. Tools like the Investor.gov compound interest calculator are useful for understanding how an initial investment can compound, but the actual future return is uncertain.
Taxes
Taxes can materially change the answer. Rental income, deductible expenses, mortgage interest, depreciation, passive activity limits, sale taxes, and depreciation recapture can all matter. The simplified scenario above does not turn tax treatment into the headline answer because tax facts depend on the owner and the property.
Common Mistakes
- Counting full rent as cash flow. Vacancy and management fees should be explicit.
- Ignoring repairs because the property looks new. Newer properties still need reserves.
- Forgetting selling costs. A property can look better before exit costs than after them.
- Using appreciation as the whole thesis. Appreciation helps, but it is not monthly cash flow.
- Comparing the property to nothing. The down payment and closing costs have an alternative use.
- Treating tax benefits as guaranteed cash. Tax value depends on income, activity rules, basis, and sale treatment.
Make the Example Your Own
Start from the $500,000 rental scenario, then test three versions:
- Lower rent from $3,600 to $3,300 and see how much monthly cash the deal asks you to fund.
- Raise vacancy, management, or operating expenses to stress-test the cushion.
- Compare 2%, 3%, and 4% appreciation against 5%, 7%, and 9% stock-return assumptions.
The goal is not to force a yes or no. The goal is to learn what the deal depends on. A good rental-property decision should survive more than one optimistic version of the spreadsheet.
Related
Sources
- IRS Topic No. 414: Rental Income and Expenses
- IRS Publication 527: Residential Rental Property
- U.S. Census Bureau: Housing Vacancies and Homeownership
- Consumer Financial Protection Bureau: Compare Loan Estimates
- FHFA: House Price Index
- Investor.gov: Compound Interest Calculator
This article is educational and not personalized investment, tax, legal, lending, or financial advice.
More Investment Property Calculator articles
Practical examples that connect the calculator to real planning decisions.
Cap Rate vs Cash-on-Cash Return: Which Rental Number Matters?
Learn the difference between cap rate and cash-on-cash return with a $400,000 duplex scenario, financing comparison, and rental-property calculator checks.
How Much Rent Do You Need for a Rental Property to Break Even?
Learn how to estimate the rent a rental property needs to break even after vacancy, management, mortgage payments, and operating expenses.